
Which asset stood out? NQ, ES, YM and RTY on Nov 5, 2026
The week’s daily candles on the four index futures, Monday’s range marked out, and the one asset that didn’t behave like the others. Then what happened after the 9:30 am open.
Last night I posted two charts on Telegram and asked which asset stood out. Here’s what I was looking at.
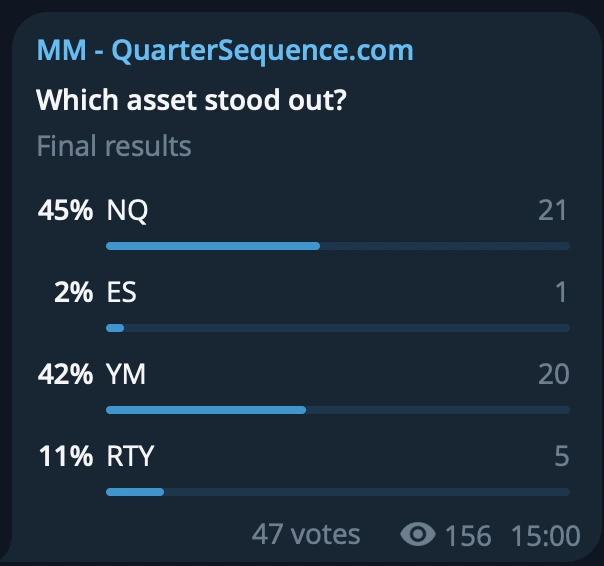
47 of you voted: 45% said NQ and 42% went for YM, with 11% on RTY and 2% on ES. I can see why some people chose YM: NQ and YM both pointed to today’s dump. But those who chose NQ, you are correct.
The week’s profile
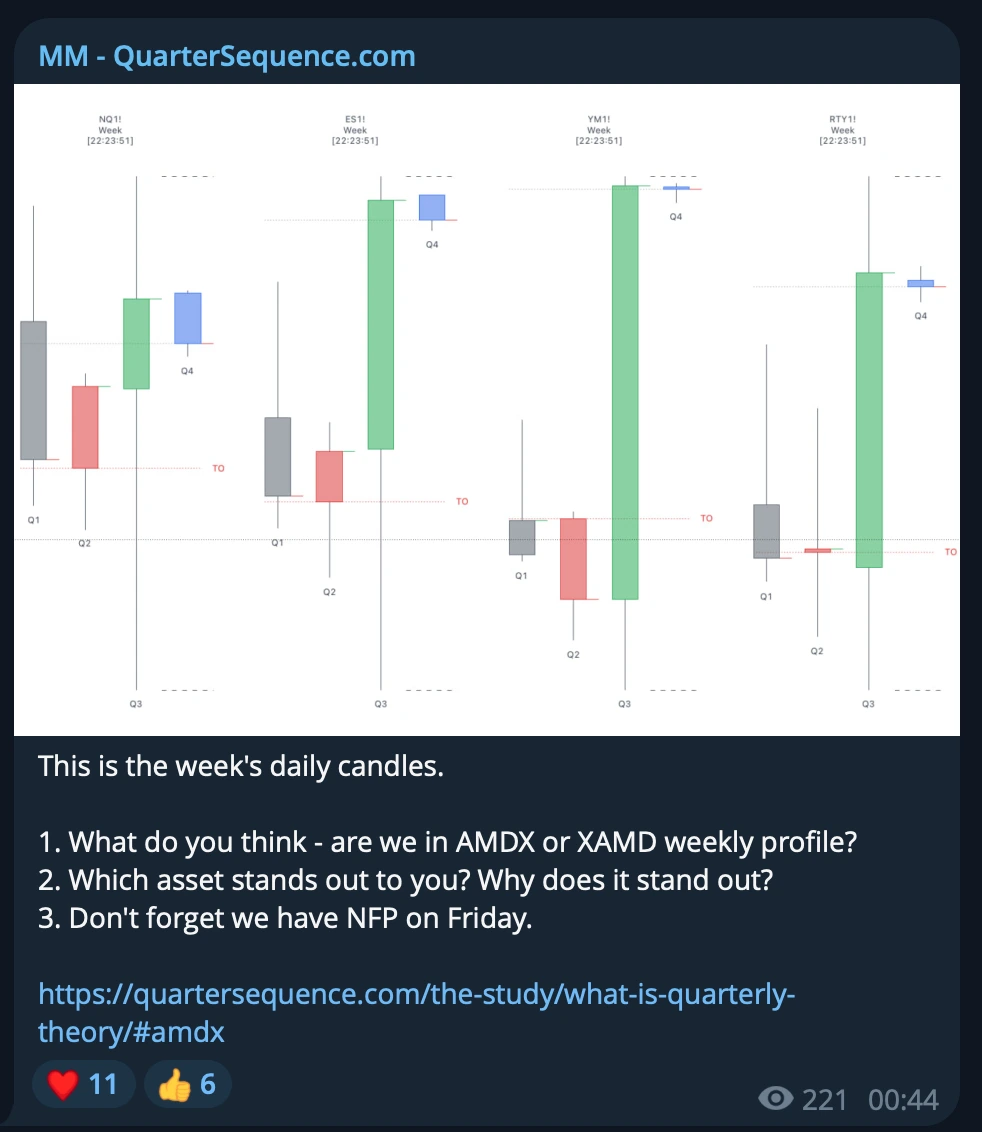
The daily candles read as XAMD, not AMDX. Monday (Q1) expanded on all four. Tuesday (Q2) was the accumulation. Wednesday (Q3) took out both sides of the week: the manipulation. That left Thursday (Q4) as the likely distribution, the main move of the week.
Monday’s candle range
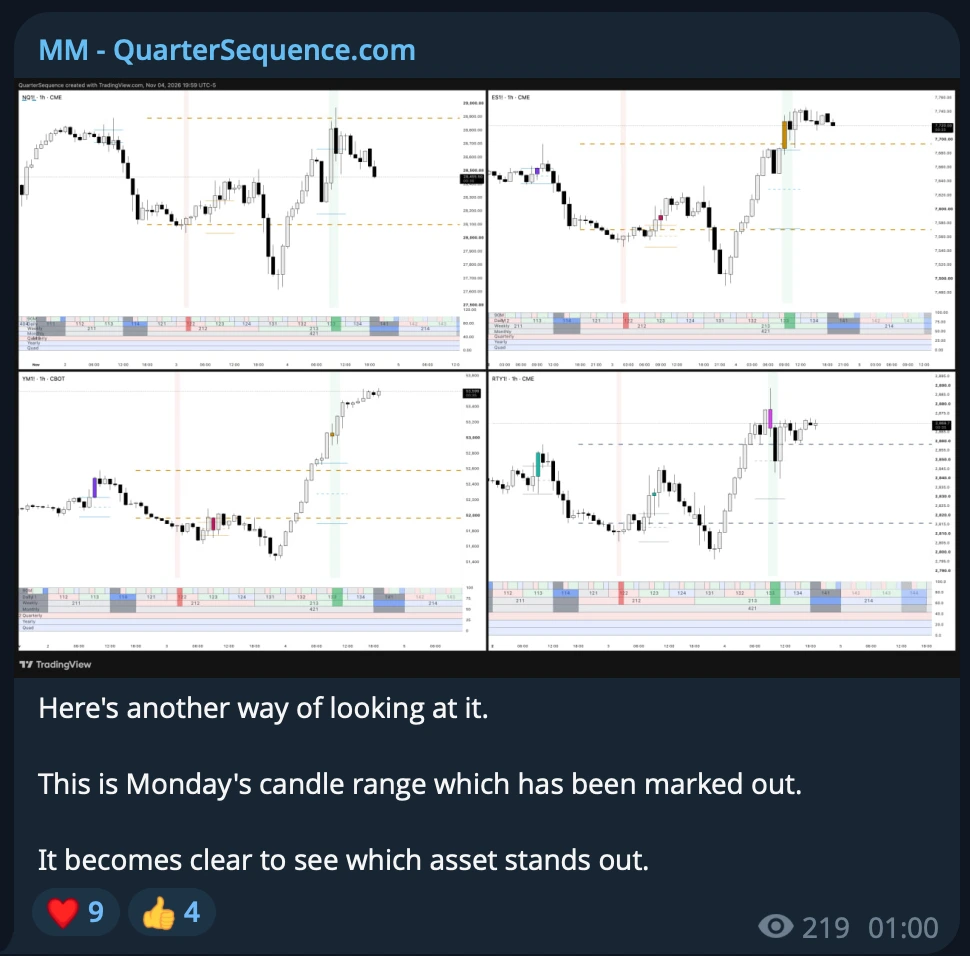
Monday’s candle is where the week’s profile starts, so its range matters. ES, YM and RTY all closed above Monday’s high. NQ only wicked above it and closed back inside: the weak one. That made NQ the truth asset, the one that held when the other three broke through, and the chart to read the rest of the week from.
When did this happen? With the Weekly Q3 Daily Q3 90m Q3. Significant, but not enough to say we had a confident bearish bias for Thursday.
The 9:00 am read
In Thursday’s Asia session YM took Wednesday’s high on its own. NQ, ES and RTY all failed to. One asset takes the high and three fail to: a bearish QS SMT. Then, up above Monday’s range, a hidden SSMT formed against Wednesday too: YM’s and RTY’s 1-hour candle bodies closed above Wednesday’s, and NQ’s and ES’s did not.
By 9:00 am New York there were four bearish QS SMTs on the chart, all at the highs. They are drawn in fuchsia below: a solid line on an asset that held, a dashed line on one that took.
- Weekly: YM took Wednesday’s high; NQ (28,969), ES (7,746.25) and RTY (2,888.7) held.
- Daily: YM and RTY took Wednesday afternoon’s high in Thursday’s Asia session; NQ (28,776.25) and ES (7,746.25) held.
- Micro: NQ, YM and RTY took their 8:15 am high; ES held 7,734.
- Nano: NQ and ES took their high; YM (53,909) and RTY (2,874.7) held.
The True Opens
Before the 9:30 am New York open, all four sat above the True Week Open and the True Day Open. Above a True Open is premium: a short bias, with discount as the target.
The 9:30 am open
At 9:30 am another bearish QS SMT formed, at the Micro. YM took its 9:00 am high by a single point (53,859 against 53,858) while NQ, ES and RTY held theirs. YM lied: from there all four sold off.
Why the bullish QS SMTs didn’t count
There were bullish QS SMTs on the chart this morning too. YM held its Daily low (53,518), its 90m low (53,599) and its Micro low (53,736) while the others took theirs, and RTY held its Nano low (2,869.2) until just after 9:00 am. Further back, RTY was holding a Monthly low at 2,784.9. So why not read the day as bullish?
- The True Opens. All four sat above the True Week Open and the True Day Open: premium, the side to sell from. A bullish SSMT up there is working against the opens.
- Monday’s range. NQ was the weak one, the only asset that couldn’t close above Monday’s high.
- The week’s profile. The week read as XAMD, which made Thursday the likely distribution, the main move of the week, after Wednesday had taken both sides.
- The truth asset and the lying asset. NQ was the truth asset: at Monday’s range it was the one asset that held while the other three closed above. YM was the lying asset, the lone sweeper. It took the Weekly high on its own while the other three held, it was the asset holding almost every one of the bullish lows, and at the open it took its Micro high alone. Bullish QS SMTs resting on the lying asset weren’t the ones to trust.
The short targets
With a short bias, the targets were the old-sequence liquidity below price: the lows made in sequences of 1s and 4s, the 1/4 levels. I only took the next one or two on each asset. NQ and ES each had one; YM and RTY had two. Each is labelled with its sequence and the cycle that made it: Mi for a Micro quarter, 90 for a 90-minute quarter, D for a session.
By late morning every one of them had been taken.
What happened next
From the 9:30 am open, all four sold off and didn’t look back. The move came in one leg: price ran straight down through the 1/4 targets, one after another, with no retrace along the way to sell into. If you weren’t short at the open, there was no second chance to get on.
It was Thursday doing what the week’s profile pointed to. With the week reading as XAMD, Thursday’s Q4 was the likely distribution, the main move of the week, and the bearish QS SMTs, premium on the True Opens and YM lying at the open had all pointed the same way.
Quarter Sequence provides charting tools and indicators, and teaches a framework - not financial advice, signals, or any promise of profit. Trading futures carries substantial risk of loss.